
This is part three of a three-part article. This article builds on the previous two articles. Here we will take a look at what we built and use it to explore the power of a zitified Prometheus. See part one for the necessary background about the series. See part two for detailed instructions covering how to setup the environment you're about to explore
The Payoff
Ok. Here it is. We are at the end of the series and here is where we'll put it all together and really start to understand the sort of innovations you can create when you zitify an application. As a reminder, we are working with Prometheus, a CNCF project which we will use to monitor a workload deployed in two separate Kubernetes clusters. To save you from flipping back to a previous article, here is what that solution looks like.

Now we are ready to start using our Prometheus servers. We'll use our OpenZiti overlay network to connect to a workload which will generate a metric we want to display in Prometheus. We'll then configure Prometheus to scrape the workload and put it on a graph to prove it works. Once that's complete, we'll play around with the setup and see if we really can scrape anything, anywhere. Let's begin.
Developer Access
In the previous article, we established our entire solution using the OpenZiti overlay, kubectl and helm. We saw
everything get installed and it all "seems to work". But how do we know it works? Let's provision an identity for yourself now and
let's enroll it in your local tunneling app and find out. Go out and get a tunneling client running
locally. Once you have that installed, provision an identity and enroll it with your tunneling client.
ziti edge create identity user dev.client -a "prometheus-clients","reflectz-clients"
You should have access to six total services when this identity is enrolled:
Service Name: kubeA.prometheus.svc
   Intercept: kubeA.prometheus.svc:80
Service Name: kubeA.reflect.svc
   Intercept: kubeA.reflect.svc.ziti:80
Service Name: kubeA.reflect.scrape.svc
   Intercept: kubeA.reflect.scrape.svc.ziti:80

Service Name: kubeB.prometheus.svc
   Intercept: kubeB.prometheus.svc:80
Service Name: kubeB.reflect.svc
   Intercept: kubeB.reflect.svc.ziti:80
Service Name: kubeB.reflect.scrape.svc
   Intercept: kubeB.reflect.scrape.svc.ziti:80
ClusterA
With your developer access you should be able to navigate your browser to http://kubea.prometheus.svc/targets.
[!NOTE] We won't dwell on this for long in this article but notice that this is showing off another superpower of OpenZiti, private DNS. Notice that you were able to browse to a totally fictitious domain name: kubea.prometheus.svc. ".svc" is not a legitimate top level domain. Look at the full list of top level domains starting with S. You won't find ".svc" on that list at this time
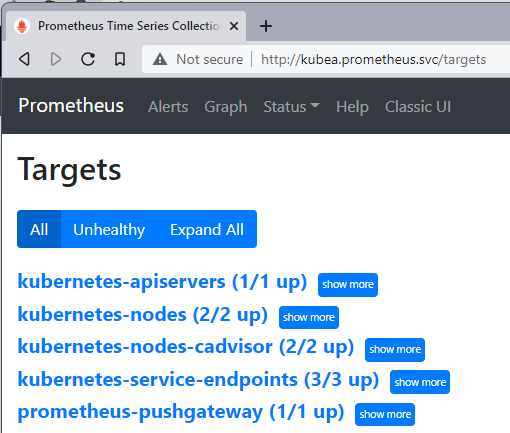
You should see the following. You might have noticed that the chart deployed has a few other containers we have not discussed yet. We'll not go into those containers in this article. What's important is that this Prometheus server has a few targets already for us to access. Neat, but this isn't what we want to actually monitor.
What we really want to monitor is the workload we deployed: reflectz. We can do this by editing the Prometheus configmap using
kubectl. Let's go ahead and do this now:
kubectl edit cm prometheuz-prometheus-server
This will open an editor in your terminal and allow you to update the config map for the pod. Once the editor is open, find the section labeled "scrape_config" and add the following entry:
    - job_name: 'kubeA.reflectz'
      scrape_interval: 5s
      honor_labels: true
      scheme: 'ziti'
      params:
        'match[]':
          - '{job!=""}'
        'ziti-config':
          - '/etc/prometheus/scrape.json'
      static_configs:
        - targets:
          - 'kubeA.reflect.scrape.svc-kubeA.reflect.id'
This is yaml and yaml is sensitive to spaces. The block above is properly indented for the config that the helm chart installs. You
should be able to simply copy it and add it under the scrape_config. Remember, there is a configmap-reload container in
the pod which monitors the configmap. On successful edit, this container will notice and will issue a web hook to the
prometheus-server container. The trigger is not immediate, don't worry if it takes a while. It can take around a minute for the
trigger to fire.
While we wait for the trigger, let's explain what this is doing. This is informing the Prometheus server to monitor a workload which can
be found at the provided target of kubeA.reflect.scrape.svc-kubeA.reflect.id. Notice that no port is included in this target, and also
notice that this is a very strange looking FQDN. That's because this is a zitified version of Prometheus. We have extended Prometheus to
understand a "scheme" of ziti. When we configure this job with a scheme of ziti, we can then supply targets to the job which represent
an OpenZiti service. We need to supply the ziti-config node with the path to the identity we want Prometheus to use to issue the
scrape. This will always be /etc/prometheus/scrape.json at this time. Should the community desire it, we can look into changing the
location of the identity.
If you would like to tail the configmap-reloadz container, you can issue this one liner. This will instruct kubectl to tail the logs
from configmap-reloadz.
pod=$(kubectl get pods | grep server | cut -d " " -f1); echo POD: $pod; kubectl logs -f "$pod" prometheus-server-configmap-reload
When the trigger happens for ClusterA you will see a message like the one below. Notice that configmap-reloadz is using the underlay
network: http://127.0.0.1:9090/-/reload
2022/04/23 20:01:23 config map updated
2022/04/23 20:01:23 performing webhook request (1/1/http://127.0.0.1:9090/-/reload)
2022/04/23 20:01:23 successfully triggered reload
Config Reloaded
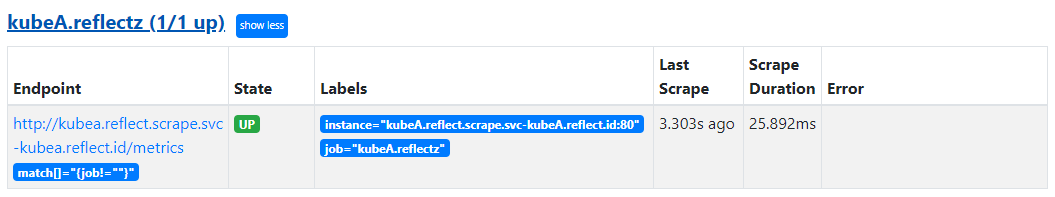
Once you've correctly updated the configmap, and configmap-reloadz detected the change and told Prometheus to reload. You'll see a new
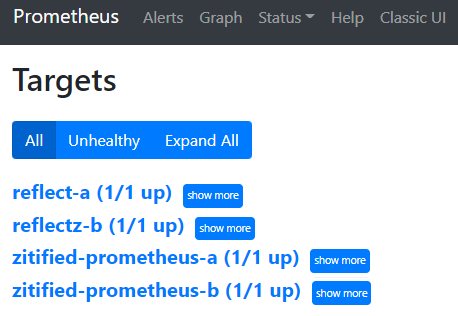
target has been reported by Prometheus at http://kubea.prometheus.svc/targets. You should now see "kubeA.reflectz (1/1 up)" showing.
Congratulations! You have just successfully scraped a target from zitified Prometheus! Remember this workload does not listen on the
Kubernetes underlay network. It's only accessible from the OpenZiti overlay.
Let's Graph It!
Cool, we have a target. The target can be scraped by Prometheus over the OpenZiti overlay. We're also able to securely access the
Prometheus UI over the same OpenZiti overlay. Let's use the Prometheus UI to graph the data point we want to see, the
reflect_total_connections metric.
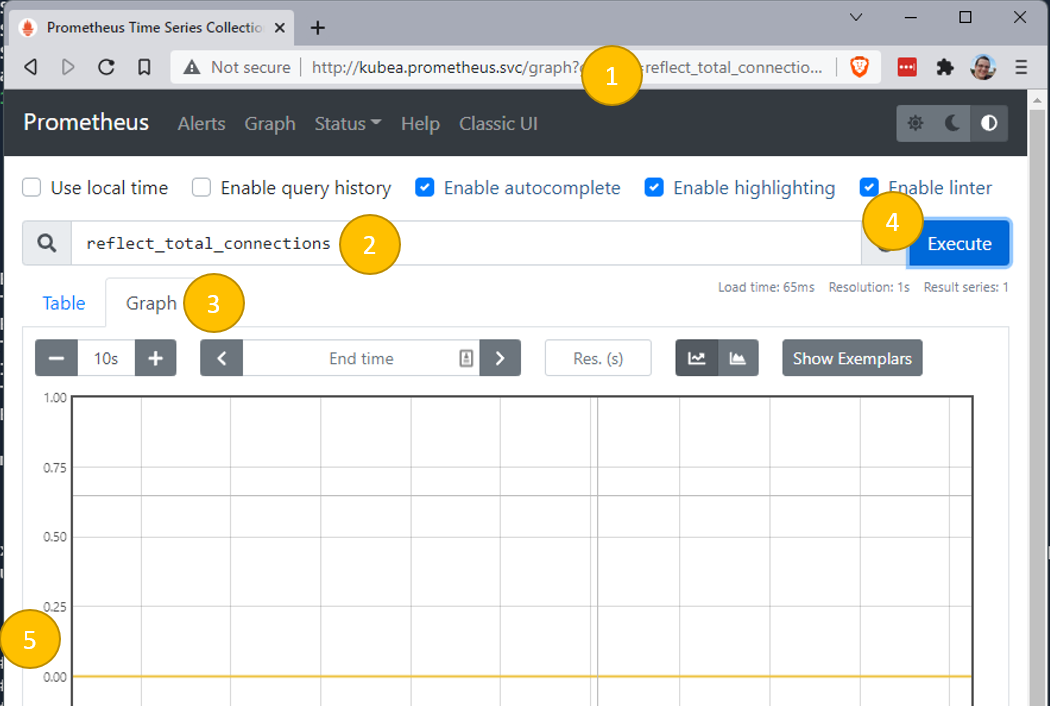
- Navigate to http://kubea.prometheus.svc/graph
- enter
reflect_total_connections - click Graph (notice I changed my time to '10s', located just under Graph)
- click Execute
- Notice there are no connections (0)
Generate Some Data
Now let's change that graph of reflect_total_connections from 0 to 1 (or more). One of the services you will have access to will
intercept kubeA.reflect.svc.ziti:80.
[!NOTE] If you are using Windows and Windows Subsystem for Linux (WSL) as I am, you might need to understand how get WSL to use your Ziti Desktop Edge for Windows as your DNS resolver when inside WSL. Generally speaking this is as easy as editing /etc/resolv.conf and adding the IP as the first nameserver:
nameserver 100.64.0.1(or whatever the DNS IP is). Try it first, depending on how you setup WSL it might 'just work' for you. You can also just use cygwin or any other netcat tool from Windows (not WSL) too.
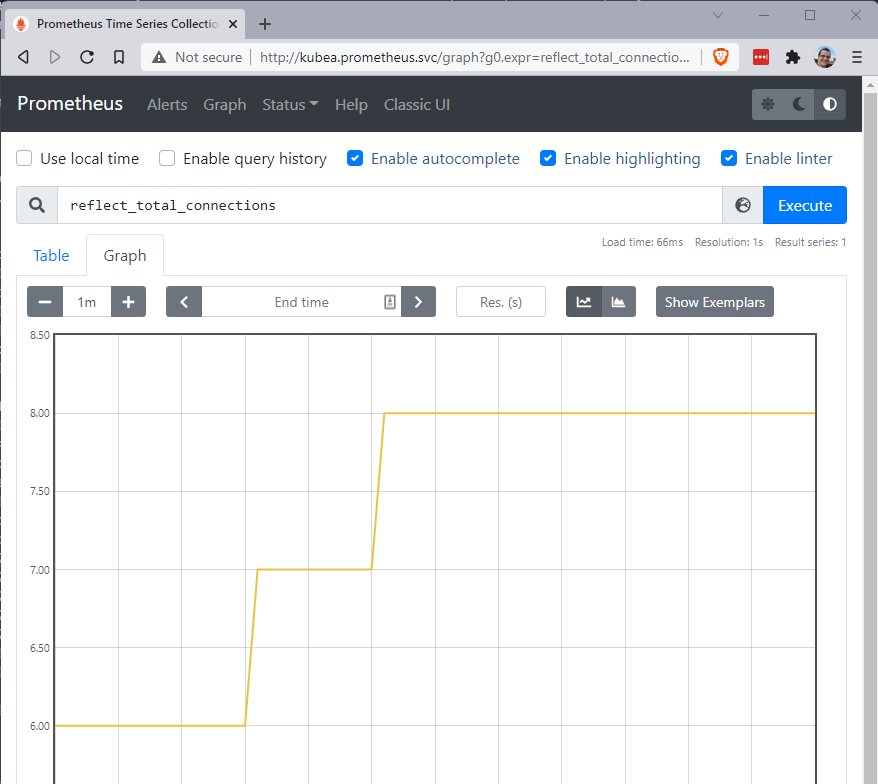
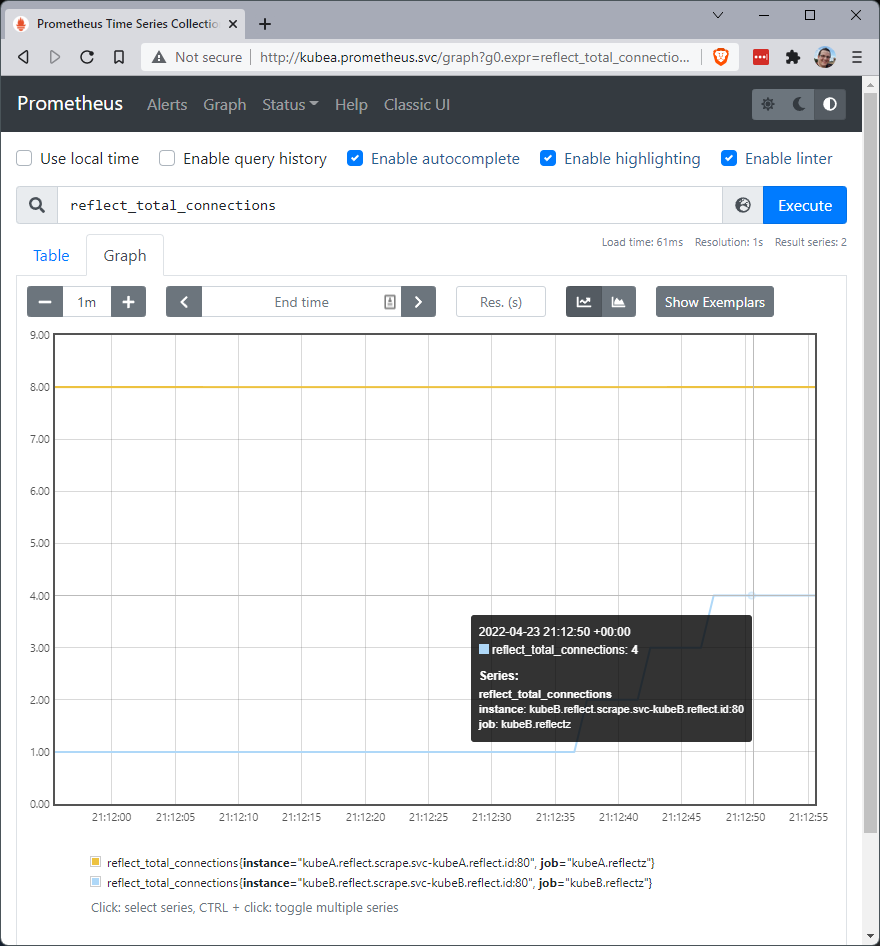
Now we can use netcat to open a connection through this intercept a few times. The metric tracks the total number of connections to the reflect service. Connect, send some text, the use ctrl-c to disconnect. Do that a few times then click 'execute' again on the graph page. You can see I did this over a minute and moved my total count on kubeA to 8, shown below.
/tmp/prometheus$ nc kubeA.reflect.svc.ziti 80
kubeA reflect test
you sent me: kubeA reflect test
^C
/tmp/prometheus$ nc kubeA.reflect.svc.ziti 80
another reflect test
you sent me: another reflect test
^C
/tmp/prometheus$ nc kubeA.reflect.svc.ziti 80
another reflect test
you sent me: another reflect test
^C
Scrape Something Else
Hopefully you agree with me that this is pretty neat. Well what if we take it to the next level? What if we tried to scrape the workload we deployed to ClusterB? Could we get that to work? Recall from above how we enabled the job named 'kubeA.reflectz'. What if we simply copied/pasted that into the configmap changing kubeA --> kubeB. Would it work? Let's see.
# edit the configmap on ClusterA:
kubectl edit cm prometheuz-prometheus-server

#add the job - and wait for the configmap to reload

    - job_name: 'kubeB.reflectz'
      scrape_interval: 5s
      honor_labels: true
      scheme: 'ziti'
      params:
        'match[]':
          - '{job!=""}'
        'ziti-config':
          - '/etc/prometheus/scrape.json'
      static_configs:
        - targets:
          - 'kubeB.reflect.scrape.svc-kubeB.reflect.id'
After watching the logs from configmap-reloadz on ClusterA and seeing the webhook trigger. Just go back to the Prometheus server in
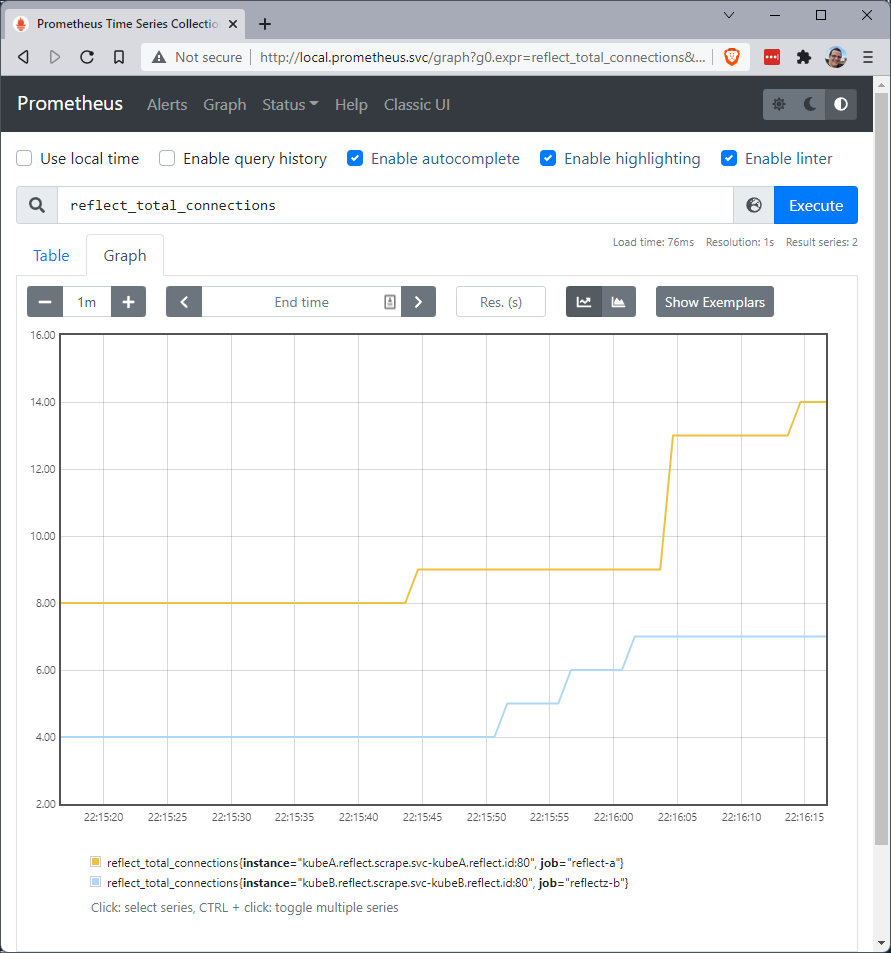
the browser. You should be at the 'graph' url but if not navigate back and execute another graph for reflect_total_connections. When
we do that it probably doesn't look much different but... Wait a second? In the legend? Can it be? That's right. From Kubernetes
ClusterA, we have just scraped a workload from Kubernetes ClusterB, entirely over the OpenZiti overlay.

Generate some data like you did before by running a few netcat connection/disconnects and click 'Execute' again. Don't forget to send the connection request to kubeB though!
nc kubeB.reflect.svc.ziti 80
this is kubeb
you sent me: this is kubeb
^C
nc kubeB.reflect.svc.ziti 80
another to kube b
you sent me: another to kube b
^C
nc kubeB.reflect.svc.ziti 80
one more for fun and profit
you sent me: one more for fun and profit
^C
Scraping All the Things!
By now, you are probably starting to get the idea just how powerful this is for Prometheus. A zitified Prometheus can scrape things
easily and natively by just deploying a Prometheuz instance into the location you want to scrape. Or, you can just enable a scrape
target using a tunneling app, or in Kubernetes using the ziti-host helm chart. Let's complete our vision now and stand up a
Prometheus server on our local workstation using Docker.
When we run Prometheuz locally using docker we'll need a config file to give to docker using a volume mount. We also provide the
identity used to connect to the OpenZiti overlay in the same fashion. Let's start up a docker container locally and see if we can grab
data from our two Prometheus instances using a locally deployed Prometheuz via docker.
GitHub has a sample Prometheus file you can download. Below, I used curl to download it and put it into the expected location.
curl -s https://raw.githubusercontent.com/openziti/ziti-doc/main/docusaurus/blog/zitification/prometheus/scripts/local.prometheus.yml > /tmp/prometheus/prometheus.config.yml

ziti edge create identity user local.prometheus.id -o /tmp/prometheus/local.prometheus.id.jwt -a "reflectz-clients","prometheus-clients"
ziti edge enroll /tmp/prometheus/local.prometheus.id.jwt -o /tmp/prometheus/local.prometheus.id.json

docker run \
  -v /tmp/prometheus/local.prometheus.id.json:/etc/prometheus/ziti.id.json \
  -v /tmp/prometheus/prometheus.config.yml:/etc/prometheus/prometheus.yml \
  -p 9090:9090 \
  openziti/prometheuz
Look at what we've just done. We have started a Prometheus instance locally, and used it to connect to four Prometheus targets via scrape configurations when all four targets are hidden entirely from my local computer (and any computer) unless the computer has an OpenZiti identity. I personally think that is incredibly cool!
Taking it to 11
But wait, I'm not done. That docker instance is listening on an underlay network. It's exposed to attack by anything on my local network. I want to fix that too. Let's start this docker container up listening only on the OpenZiti overlay. Just like in part 2 we will make a config, a service and two policies to enable identities on the OpenZiti overlay.
curl -s https://raw.githubusercontent.com/openziti/ziti-doc/main/docusaurus/blog/zitification/prometheus/scripts/local.prometheus.yml > /tmp/prometheus/prometheus.config.yml

# create the config and service for the local prometheus server
ziti edge create config "local.prometheus.svc-intercept.v1" intercept.v1 \
  '{"protocols":["tcp"],"addresses":["local.prometheus.svc"],"portRanges":[{"low":80, "high":80}], "dialOptions": {"identity":"local.prometheus.id"}}'

ziti edge create service "local.prometheus.svc" \
  --configs "local.prometheus.svc-intercept.v1"

# grant the prometheus clients the ability to dial the service and the local.prometheus.id the ability to bind
ziti edge create service-policy "local.prometheus.svc.dial" Dial \
  --service-roles "@local.prometheus.svc" \
  --identity-roles "#prometheus-clients"
ziti edge create service-policy "local.prometheus.svc.bind" Bind \
  --service-roles "@local.prometheus.svc" \
  --identity-roles "@local.prometheus.id"
Once that's done - let's see if we can start the docker container. The helm charts are configured to translate the --set flags
provided into "container friendly" settings like environment variables, volumes and mounts etc. In docker we need to provide those. If
you're familiar with docker these will probably all make sense. The most important part of the command below is the lack of a -p
flag. The -p flag is used to expose a port from inside docker, outside docker. Look at the previous docker sample and you'll find we
were mapping local underlay port 9090 to port 9090 in the docker container. In this example, we will do no such thing! :)
docker run \
    -e ZITI_LISTENER_SERVICE_NAME=local.prometheus.svc \
    -e ZITI_LISTENER_IDENTITY_FILE=/etc/prometheus/ziti.server.json \
    -e ZITI_LISTENER_IDENTITY_NAME=local.prometheus.id \
    -v /tmp/prometheus/prometheus.config.yml:/etc/prometheus/prometheus.yml \
    -v /tmp/prometheus/local.prometheus.id.json:/etc/prometheus/ziti.id.json \
    -v /tmp/prometheus/local.prometheus.id.json:/etc/prometheus/ziti.server.json \
    openziti/prometheuz
But - Does It Work?
After configuring the OpenZiti overlay, we just need to open a browser and navigate to http://local.prometheus.svc/targets. SUCCESS!
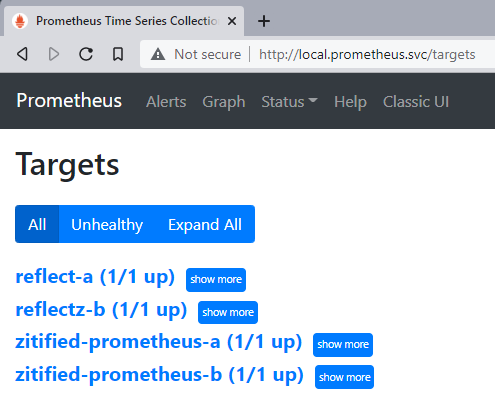
SUCCESS!
Wrap Up
This was quite the journey and a lot of fun. We have taken a wildly popular open source project and brought OpenZiti to it with really not much code at all. Then using OpenZiti we were able to give Prometheus superpowers and enable it to scrape any target regardless of where that target is or what network it is on.
Think of the possibilities here. Are you a cloud provider looking to monitor your client's services which are deployed on-prem? That's so easy with OpenZiti and without sacrificing security at all. In fact, using OpenZiti like this provides amazing reach while strengthening the security posture of the solution because you're now using the concepts of zero trust networking principles and applying them to your alerting and monitoring solution.
What do you think? Was this series interesting? Do you think OpenZiti is cool and you are looking to try it out? What are you going to zitify? Tell us on twitter or on discourse! Both links are included in this page. Let us know what you think! Go star the openziti/ziti repo and help us spread the word of OpenZiti to the world!